Input the model and experiment data to execute parameter estimation
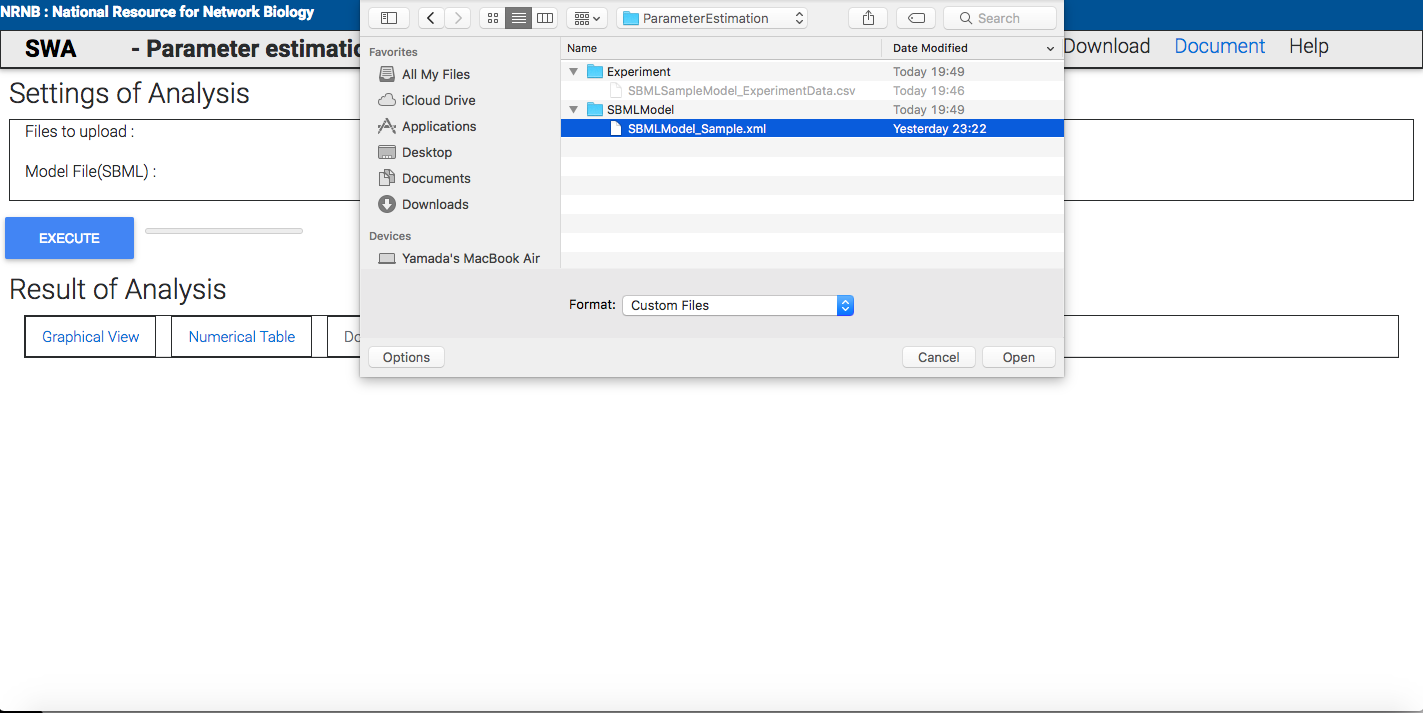
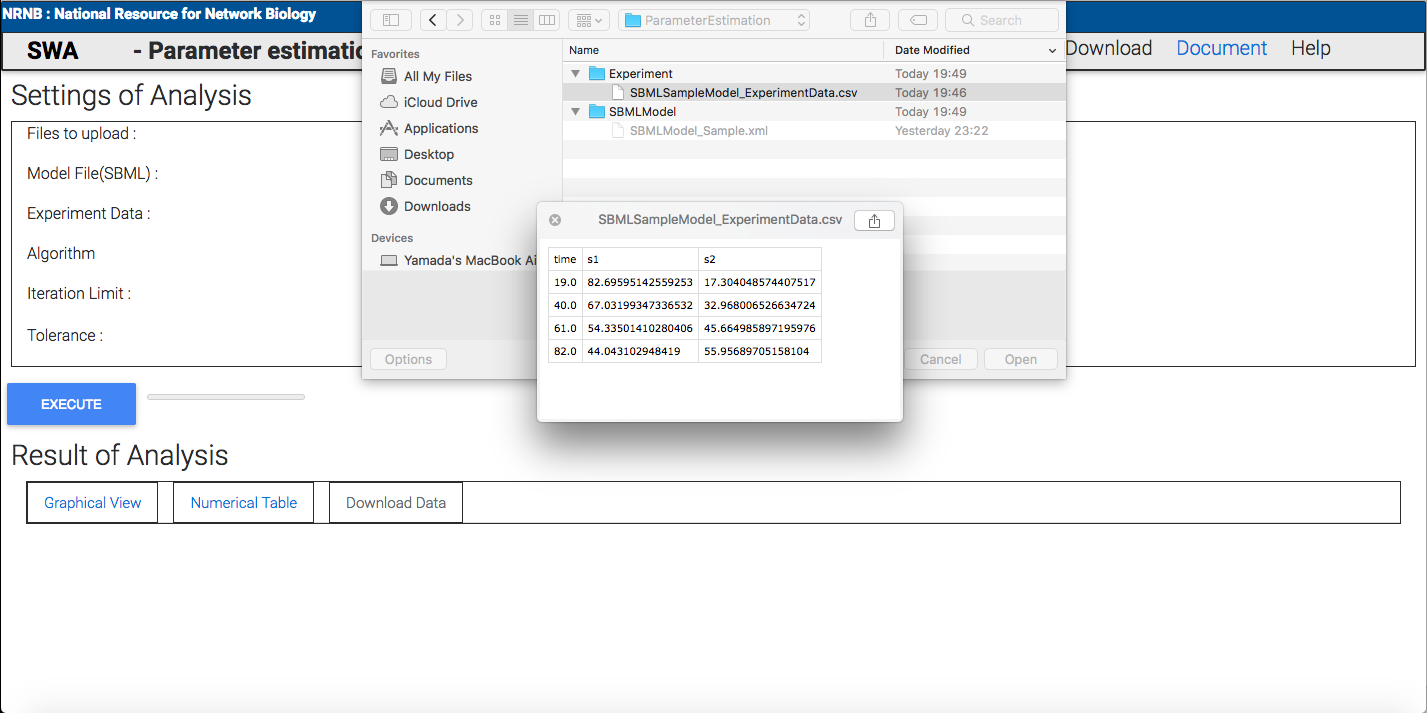
This is simple to execute parameter estimation selecting SBML model and experimental data on your computer. Experimental data should be "csv" or "txt" format and each column refers to the species in model and row refers to time point. The name of column should be the SBML ID in your model and of row should be positive number.
|
| Fig 1 : Input SBML file. |

|
| Fig 2 : Input experiment data. |
|
| Fig 3 : The format of experiment data. |
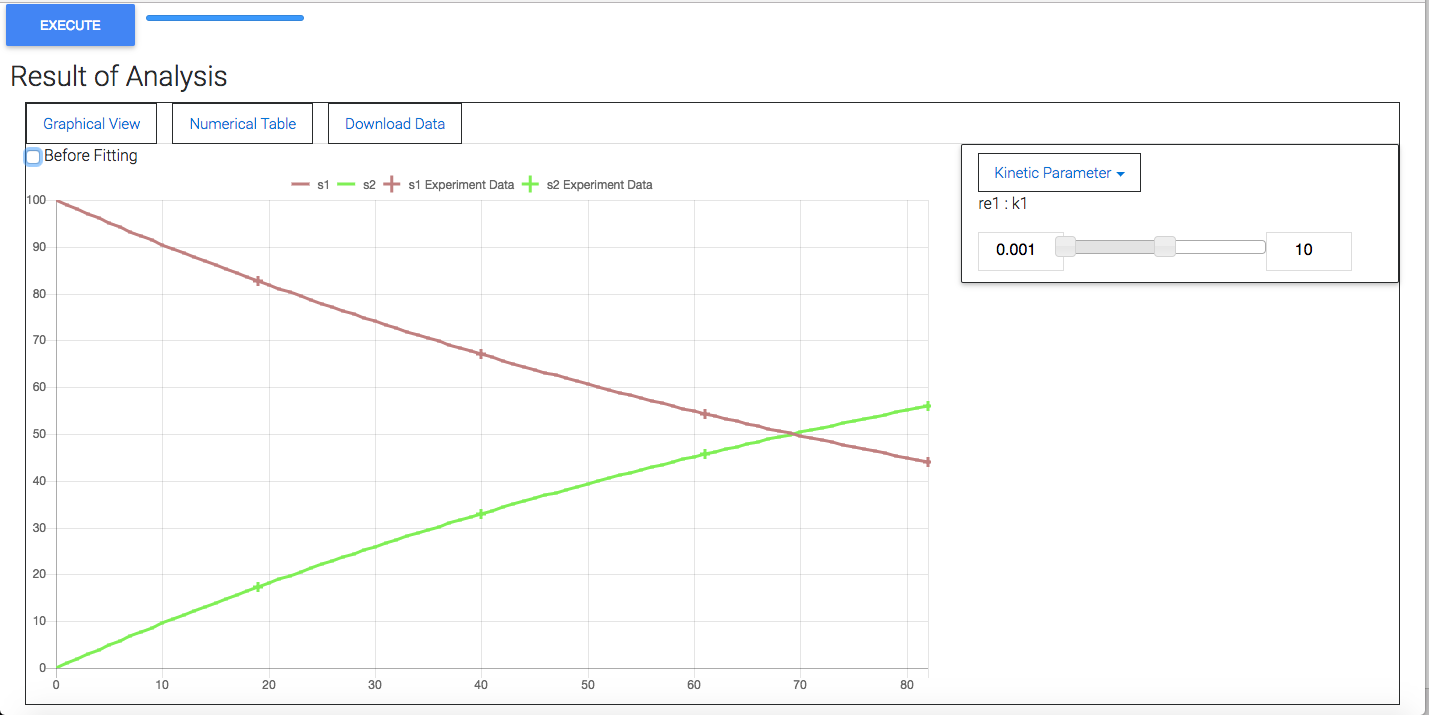
Then pressing "Execute" button, you can get the results of parameter estimation which are graphical view and numerical table.
|
| Fig 4 : Visualize graphical result. The line shows the simulation results with fitted parameter and cross of plot shows the experimental data. |

|
| Fig 5 : Visualize numerical table. Column refers to reaction ID of the parameter , parameter , lower bound, start value ,upper bound of parameter as a setting parameter and the updated value of this parameter and unit as a result. |