Input the model and execute simulation
This is really simple to execute simulation only selecting SBML model on your computer.

|
| Fig 1 : Input SBML file.
|
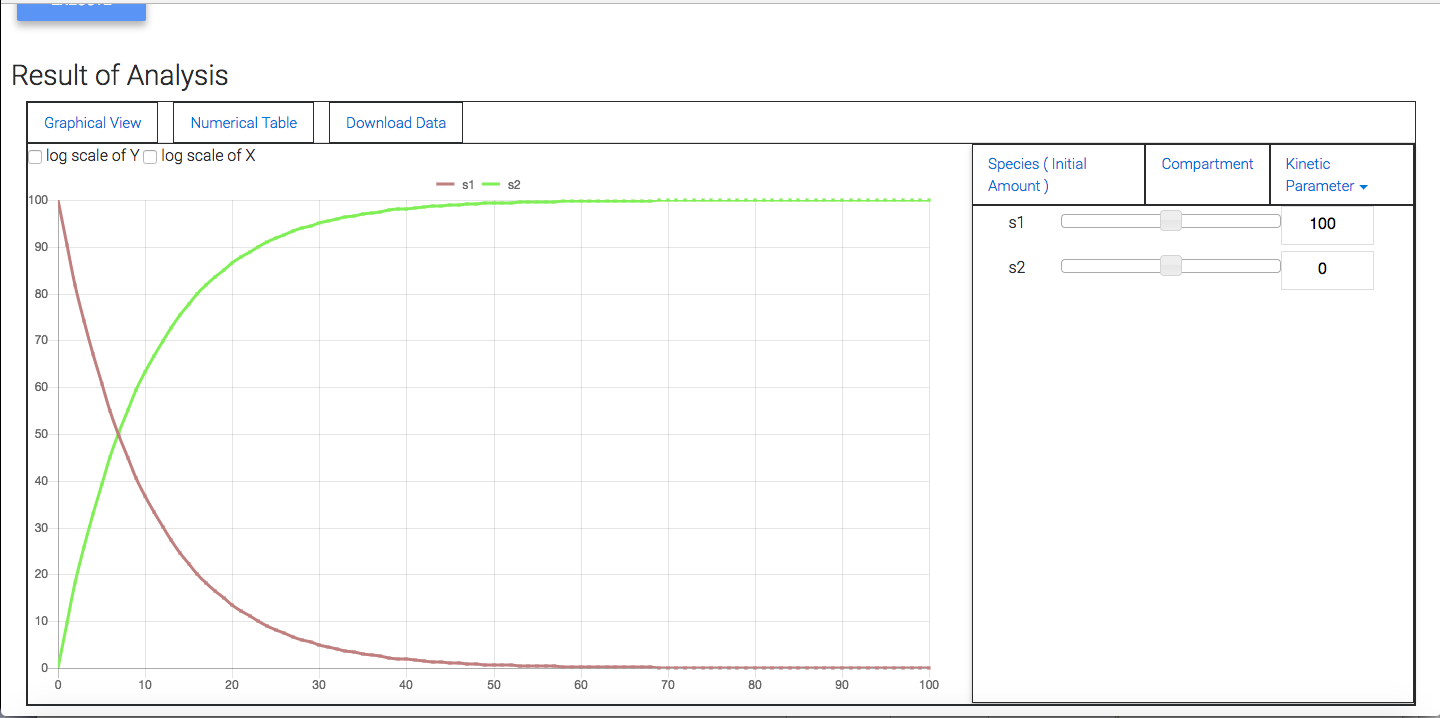
Then pressing "Execute" button, you can get the results of simulation which are graphical view and numerical table.
|
| Fig 2 : Visualize graphical result. Vertical axis shows time and horizontal axis shows the amount or concentration of each species.
|

|
| Fig 3 : Visualize numerical table. Each column refers to species in your model and row refers to time point
|